3.6 Modeling Direct Variation
Video Explanation
Vocabulary
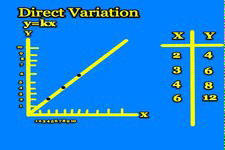
direct variation - the linear equation of the form y = ax (a does not equal 0) and y is said to vary directly with x.
constant of variation - the constant a in the direct variation equation y = ax. It can be found by dividing y by x (y/x).
HOMEWORK
Video Explanation
Vocabulary
direct variation - the linear equation of the form y = ax (a does not equal 0) and y is said to vary directly with x.
constant of variation - the constant a in the direct variation equation y = ax. It can be found by dividing y by x (y/x).
HOMEWORK
|
|
3.4 & 4.3 Graphing & Writing Linear Equations in Standard Form
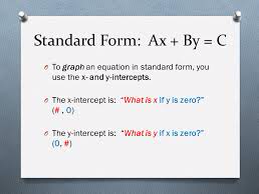
Video Notes Notes Key & Classwork Assignment HOMEWORK (turtle) Vocabulary standard form - the linear equation, Ax + By = C, where A, B, and C are real numbers and A and B are not both zero. x-intercept - the x-coordinate of a point where the graph crosses the x-axis. It occurs when y = 0. y-intercept - the y-coordinate of a point where the graph crosses the y-axis. It occurs when x = 0. zero of a function - an x-value for which f(x) = 0 (or y = 0). It is an x-intercept of the graph of the function. |
|
4.2 Writing Equations in Point-Slope Form
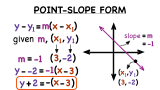
Video Notes Notes Key & Classwork Assignment HOMEWORK (beaver) Vocabulary point-slope form - a linear equation written in the form y - y1 = m(x - x1). the line passes through the point (x1, y1) & has a slope m. |
|
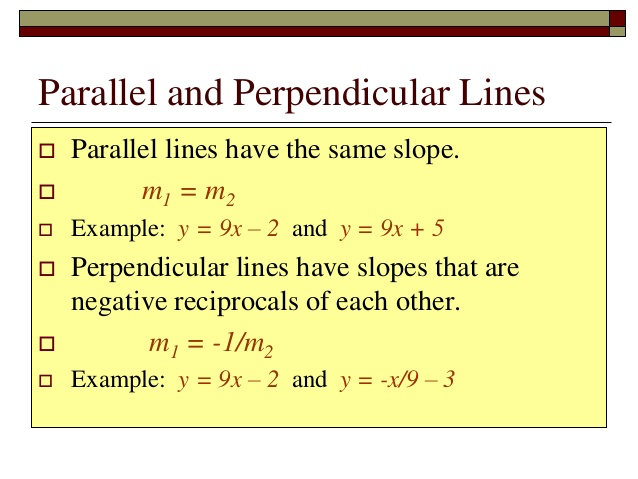
4.4 Writing Equations of Parallel and Perpendicular Lines
Video Notes Notes Key & Classwork Assignment HOMEWORK (bee) Vocabulary parallel lines - two lines in the same plane that never intersect. Non-vertical lines with the same slope perpendicular lines - two lines in the same plane that intersect to form right angles. non-vertical lines that have negative reciprocal slopes. |
|
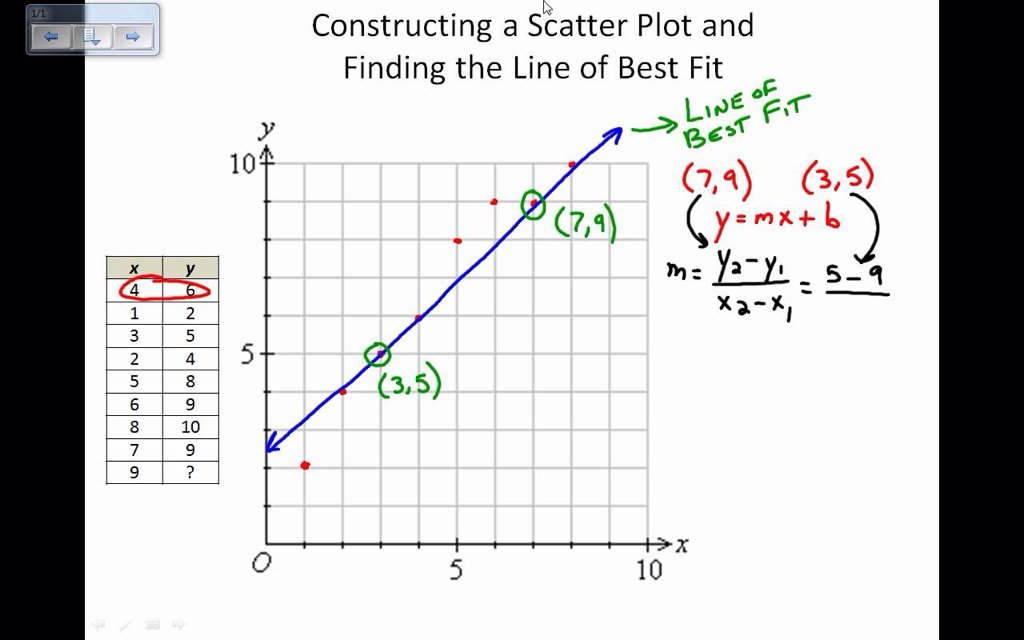
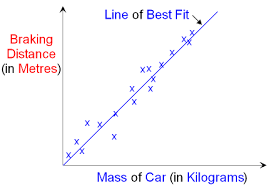
4.5 Scatter Plots and Lines of Fit
Video Notes Classwork HOMEWORK (cow) Vocabulary scatter plot - a graph that shows the relationship between two data sets that are graphed as ordered pairs on a coordinate plane. It is used to show trends in data. correlation - a relationship between data sets. It is said to be either positive, negative or no. positive correlation: as x increases, y increases negative correlation: as x increases, y decreases, no: no pattern line of fit - a line drawn on a scatter plot that is close to most of the data points. It is also called a trend line. |
|
4.6 Analyzing Lines of Fit
Video Notes Vocabulary residual - the difference of the y-value of a data point and the corresponding y-value found using the line of fit. It can be positive, negative, or zero linear regression - a method the graphing calculator uses to find a precise line of fit that models a set of data line of best fit - a line that best models a set of data correlation coefficient - a value, r, (between -1 and 1) that tells how closely the equation of the line of best fit models the data When r is close to 1 or -1, there is a strong correlation, as r is closer to 0, the correlation becomes weaker. (0 is no correlation) interpolation - to approximate a value between two known values using a graph or its equation extrapolation - to predict a value outside the range of known values using a graph or its equation causation - when a change in one variable causes a change in another variable. It produces a strong correlation between the two variables. (However, a strong correlation does not imply causation) |
